
Using Artificial Intelligence to forecast COVID-19 cases in Cyprus: 12/6/2021-10/7/2021
The Data Science Team of PHOEBE Innovations, in collaboration with the KIOS Research and Innovation Center of Excellence, have been working during the last 6 months on an innovative way to forecast COVID-19 cases using Artificial Intelligence, as part of the CONTROL4COVID project funded by the Research and Innovation Foundation.
Following the recent relaxation of COVID-19 intervention measures in Cyprus, our team considered it interesting to try and forecast the COVID-19 cases, covering the period between 12 June 2021 to 10 July 2021, using all available data up until 1st June 2021.
The algorithms’ mathematical models have been trained using historical data of COVID-19 since its first outbreak in March 2020, considering data from different countries. The predictions assume two different profiles of intervention measures: the “minimum” (which actually means that no intervention measures are applied) and the “freeze” (which keeps the last known intervention measures, that is, the ones applied around 9 June 2021). The vaccinations are assumed to follow a steady rate, i.e., the daily vaccinations are calculated according to the average daily vaccinations of the 14 days before 12 June 2021.
Figures 1 and 2 present the results for the two prediction profiles described above. The black line represents the actual daily cases in Cyprus (as available at the time of the experiment), while the orange and blue lines (and respective uncertainty areas) represent the predicted cases for the minimum and freeze cases, respectively.
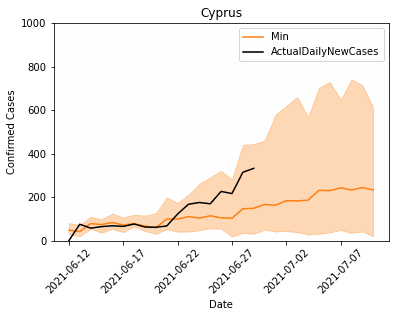
In Figure 1, we observe that if no intervention measures were in place, the COVID-19 cases could potentially reach up to 700 by July 10 (considering all the uncertainties) with an average value of 200. However, since the actual daily new cases at the end of June appear to be much more than what the “average” prediction suggests, this implies that from all the possible scenarios, we are experiencing one which is closer to the worst-case one.
In Figure 2, the freeze prediction plan suggests that if the current intervention measures continued to be active and citizens continued to respect them, daily new cases should remain steady and be limited below 200, with the average closer to around 50, by the end of the forecasting period. It appears that the actual daily new cases are significantly higher than what the prediction suggests.
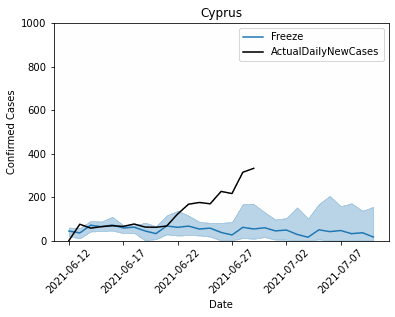 Figure 2. Forecasting with the "freeze" intervention program.
Our forecasting does not interpret these differences, as this needs to be performed by experts in epidemiology, to enable taking the appropriate intervention measures. For instance, experts need to evaluate the hypotheses whether the difference can be attributed to the new variants of the virus, D and G, which were not present in the training data set a lot, or whether they can be attributed to the citizens not respecting the governmental guidelines. Depending on the findings, they may need to differentiate the response intervention measures.
The PandoraSEAL Platform provides a tool which allows policy makers to better manage emergency situations, by making informed decisions. More information on the PandoraSEAL Platform and how it works can be found at: https://phoebeinnovations.com/blog/articles-and-news-from-out-activities-1/post/the-first-prototype-of-the-pandoraseal-platform-has-been-released-13.